Graphing Title

Story Actions:

  • 55 mph for one hour
  • 25 mph for 45 minutes
  • 30 mph for 30 minutes
  • 65 mph for one hour
  • stopped for a snack

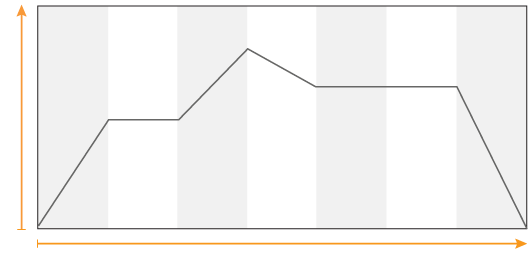
Graphs can be used to describe situations in stories. Using the graph as a guide, drag each story action to its correct place in the story.

My family went on a day trip to the beach. We left at 8 a.m. and drove
___________________ , until we reached the highway. We drove
___________________ , then ___________________ . When we got
back onto the highway, construction merged traffic into one lane, and we averaged about ___________________ . Once the traffic cleared, we sped up to ___________________ , until we reached the beach at noon.

Click on the pencil, then sketch the line graph. To erase any part of the line, first click on the eraser.

Sketch

Pencil On

Erase

Eraser Off
Clear Btn Off
Checkwork Btn Off

Read the following story. Then sketch a graph that tells the same story. Assume the car will need a very short time to speed up and slow down.

My dad drove me to school this morning. We drove for 10 minutes at about 30 mph. We then slowed to half that speed for the next 5 minutes before stopping at a stoplight for 2 minutes. We got on the highway and drove at 50 mph for 20 minutes. We got off the highway and stopped at a stop sign for a minute. We drove at 20 mph for another 10 minutes, then turned into the school’s driveway and stopped.

View Instructions Write View Sample Print

Graph Labels:

  •  CUSTOMERS
  •  HOURS
  •  TEMPERATURE
  •  DAYS
  •  MONEY
  •  WEEKS
Here is a graph without a story. For this activity, write your own story to match the graph: a “bake sale” story that shows the number of customers over the course of a school day, a “weather” story that describes daytime temperatures over a weeklong period, or a “savings” story that explains how much money you earned working jobs and then spent over summer vacation.

Drag the appropriate label to each axis of the graph. Be sure your story explains what’s happening at each section along the line.

Write Your Story >

Any story that talks about changes over a period of time could work. Here is one that talks about changes in altitude over the course of an airplane flight:

An airplane took off at 1 p.m. and climbed to 20,000 feet. It leveled off for about an hour and then climbed again to 35,000 feet. The pilot announced there was some turbulence, and he took the plane down to 30,000 feet. The plane stayed at that altitude for an hour before beginning its descent. It landed at its destination at 7 p.m.

Write Your Story >

T3 Canvas
Close Btn Try again. 30 mph is much slower than the speed on the graph, and 30 minutes is half of the duration on the graph at that point in the story.
Close Btn Try again. 30 mph is much faster than the speed on the graph, and 30 minutes is longer than the duration on the graph at that point in the story.
Close Btn Try again. 30 mph is slightly faster than the speed on the graph, and 30 minutes is shorter than the duration on the graph at that point in the story.
Close Btn Try again. 30 mph is much slower than the speed on the graph, and 30 minutes is half of the duration on the graph at that point in the story.
Close Btn Try again. 55 mph is much faster than the speed on the graph, and one hour is twice as long as the duration on the graph at that point in the story.
Close Btn Try again. 55 mph is much faster than the speed on the graph, and one hour is much longer than the duration on the graph at that point in the story.
Close Btn Try again. 55 mph is much faster than the speed on the graph, and one hour is longer than the duration on the graph at that point in the story.
Close Btn Try again. 55 mph is slightly slower than the speed on the graph at that point in the story.
Close Btn Try again. Look for the point in the story graph where the speed is 0 mph.
Close Btn Try again. 25 mph is slightly slower than the speed on the graph, and 45 minutes is longer than the duration on the graph at that point in the story.
Close Btn Try again. 25 mph is much slower than the speed on the graph, and 45 minutes is shorter than the duration on the graph at that point in the story.
Close Btn Try again. 25 mph is much faster than the speed on the graph, and 45 minutes is much longer than the duration on the graph at that point in the story.
Close Btn Try again. 25 mph is much slower than the speed on the graph, and 45 minutes is shorter than the duration on the graph at that point in the story.
Close Btn Try again. 65 mph is much faster than the speed on the graph, and one hour is twice as long as the duration on the graph at that point in the story.
Close Btn Try again. 65 mph is slightly faster than the speed on the graph at that point in the story.
Close Btn Try again. 65 mph is much faster than the speed on the graph, and one hour is much longer than the duration on the graph at that point in the story.
Close Btn Try again. 65 mph is much faster than the speed on the graph, and one hour is longer than the duration on the graph at that point in the story.
Close Btn

Your graph should look something like this. If it doesn't, try to figure out why. You may also “Close,” click on “Clear,” and sketch it again.